
Scaling Helmets Labeling Crops: Unlocking Critical Agricultural Data Across Africa and Beyond
Machine learning can map the world's croplands — but only where somebody has first stood in a field and written down what is growing there. Across smallholder Africa, almost nobody has. We put a camera on a helmet, on a motorbike that was already making the trip, and turned an ordinary working commute into one of the largest ground-truth agricultural datasets in the world.
Read the paper in Nature Scientific Data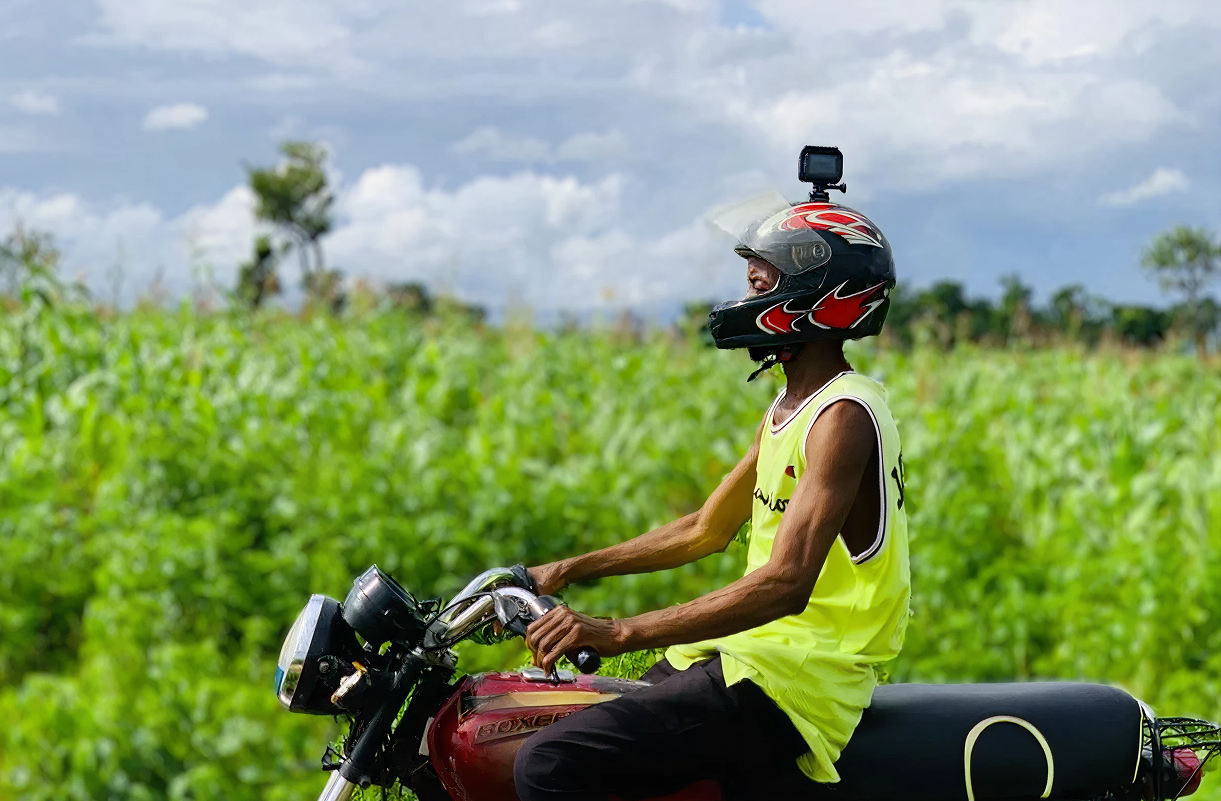
The data that doesn't exist
Every crop map, yield forecast, and food-security early warning system built on satellite imagery rests on the same foundation: labeled examples. A model cannot learn to recognize maize from orbit until it has been shown thousands of places where maize is definitely, verifiably growing.
In the United States and the European Union, those labels arrive by the million from national cropland data layers and mandatory farm registries. In the smallholder farming systems that feed most of sub-Saharan Africa, they are close to nonexistent. Fields are small — often well under a hectare — irregularly shaped, intercropped, and planted on schedules that shift with the rains. These are precisely the conditions under which a satellite model needs the most local training data, and precisely where the least of it exists.
The conventional remedy is a field campaign: enumerators, vehicles, GPS units, per-diems, weeks of travel. It produces excellent data. It produces a few thousand points, for one season, at a cost that cannot be repeated annually and cannot be scaled to a continent. The labels go stale, the models drift, and the gap reopens.
The bottleneck in African agricultural monitoring was never the satellites. It was knowing what was on the ground underneath them.
A camera on a helmet, on a trip already being made
Agricultural extension officers ride motorbikes through farming districts every working day. They pass hundreds of fields — the same fields, week after week, season after season. That journey is the most under-used data collection asset in African agriculture.
Our approach is deliberately, almost stubbornly, low-cost: equip extension officers with helmet-mounted GoPro cameras and let them ride. No change to their route. No additional stops. No survey instrument. The camera records continuously at a fixed interval, each frame carrying a GPS coordinate, and at the end of the day the card is handed over.
What arrives is not a crop-type dataset. It is a very large pile of roadside photographs. Street2Sat, the deep learning pipeline at the centre of this project, is what converts one into the other — locating crops in each frame, projecting them from the road into the field where they actually stand, and resolving them onto the same grid the satellites see.
The economics are what make it scale. A single officer on a routine week of travel generates more georeferenced labels than a conventional field campaign collects in its entire budget cycle — and does it again the following week.
How a roadside photo becomes a crop label
Fig. 1 — The Street2Sat pipeline. Roadside imagery is geolocated, offset into the adjacent field, snapped to the Sentinel-2 grid, and resolved to a dominant crop type for each cell.
Road coordinate capture
Each frame is stamped with the GPS position of the camera, not the crop — a point on the road, with a heading from the motorbike's direction of travel. Blurred, obstructed and non-agricultural frames are filtered out first.
20 m field offset
The observation is projected 20 metres perpendicular to travel, moving the label off the roadside verge and into the body of the field. This is what separates an agricultural label from a photograph of a ditch.
10 m grid snapping
The offset point snaps to the 10 m Sentinel-2 grid — the native resolution of the imagery it will train. Aligning here means every label joins directly to a pixel time series, with no resampling and no coordinate drift.
Dominant crop prediction
Multiple observations in one cell — common, since a motorbike passes the same field repeatedly — resolve to a single dominant crop type, with a confidence score from inter-observation agreement.
The archive
Years of routine motorbike travel, across nine countries and three continents, have produced one of the largest georeferenced roadside agricultural imagery collections in existence.
16.6TB
6.6 million+ JPGs of georeferenced roadside imagery, collected by extension officers on routine travel — the complete Street2Sat archive across every collection site.
13TB
5.5 million images held on the UMD Geographical Sciences cluster, spanning Kenya, Tanzania, Uganda, Zambia, Senegal, Madagascar, Nigeria, Brazil and the United States.
3.6TB
Over 1 million processed images in the street2sat-crops bucket — the analysis-ready tier the pipeline reads from, and the source of open dataset releases.
Figures current as of the 2026 Lacuna Fund reporting period. Country coverage spans Kenya, Tanzania, Uganda, Zambia, Senegal, Madagascar, Nigeria, Brazil, and the United States.
Published, and now being rebuilt for scale
The dataset and pipeline are documented in Nature Scientific Data (2025), open-access and citable. The current phase of work, supported by the Lacuna Fund, is about turning a research pipeline into infrastructure other people can rely on.
Street2Sat pipeline modernization
Re-engineering the processing chain for throughput and reproducibility, so that a season's imagery moves from SD card to analysis-ready labels without manual intervention — and so that others can run it on their own imagery.
Open-source dataset releases
Publishing the processed crop-type labels under an open license, in formats that drop directly into standard Earth observation workflows. The value of this data compounds only if it leaves our servers.
Annual update and validation protocols
Establishing the procedure by which the dataset is refreshed each season and its accuracy independently checked — the difference between a dataset and a living data product. A one-off release goes stale in two seasons; a validated annual update stays useful indefinitely.
Use the data
The Street2Sat dataset is open, documented, and citable. If you are building crop monitoring systems for smallholder agriculture — or you run an extension service whose officers are already making the trip — we would like to hear from you.
Street2Sat is published open-access in Nature Scientific Data (2025). doi.org/10.1038/s41597-025-05762-7
Please cite the article directly; the full author list and title are on the DOI landing page.